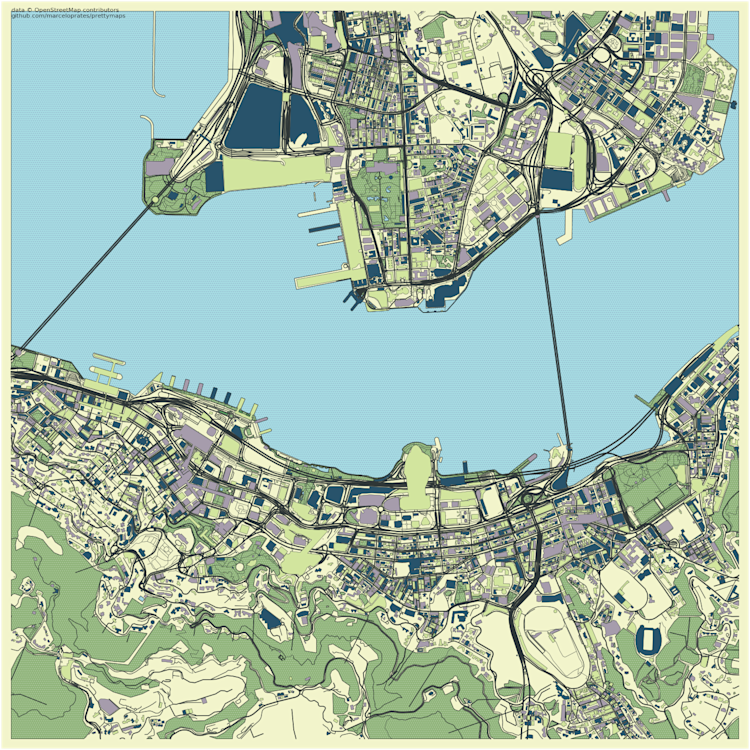
Customize maps with Prettymaps
A minimal Python library to draw customized maps from OpenStreetMap created using the osmnx, matplotlib, shapely and vsketch libraries.
Prettymaps is A minimal Python library to draw customized maps from OpenStreetMap created using the osmnx, matplotlib, shapely and vsketch libraries.
install prettymaps
To start generating maps, first install prettymaps using pip
$ pip install prettymaps
import prettymaps
# For local execution (does not require installing the library):
%load_ext autoreload
%autoreload 2
import sys; sys.path.append('../')

# Prettymaps
from prettymaps import *
# Vsketch
import vsketch
# OSMNX
import osmnx as ox
# Matplotlib-related
import matplotlib.font_manager as fm
from matplotlib import pyplot as plt
from descartes import PolygonPatch
# Shapely
from shapely.geometry import *
from shapely.affinity import *
from shapely.ops import unary_union
Select locations from OpenStreetMap
Next is to get data from OpenStreetMap, Prettymaps allows you to use the name of the address you would like to create map.

Generate the map
The following is from example of Prettymaps GitHub repo, and I have made modtifcations based on needed.
#Init matplotlib figure
fig, ax = plt.subplots(figsize = (12, 12), constrained_layout = True)

backup = plot(
    # Address: #This is where to input the name of address
    'Hong Kong Island',
    # Plot geometries in a circle of radius:
    radius = 1100,
    # Matplotlib axis
    ax = ax,
    # Which OpenStreetMap layers to plot and their parameters:
    layers = {
            # Perimeter (in this case, a circle)
            'perimeter': {},
            # Streets and their widths
            'streets': {
                'width': {
                    'motorway': 5,
                    'trunk': 5,
                    'primary': 4.5,
                    'secondary': 4,
                    'tertiary': 3.5,
                    'residential': 3,
                    'service': 2,
                    'unclassified': 2,
                    'pedestrian': 2,
                    'footway': 1,
                }
            },
            # Other layers:
            #   Specify a name (for example, 'building') and which OpenStreetMap tags to fetch
            'building': {'tags': {'building': True, 'landuse': 'construction'}, 'union': False},
            'water': {'tags': {'natural': ['water', 'bay']}},
            'green': {'tags': {'landuse': 'grass', 'natural': ['island', 'wood'], 'leisure': 'park'}},
            'forest': {'tags': {'landuse': 'forest'}},
            'parking': {'tags': {'amenity': 'parking', 'highway': 'pedestrian', 'man_made': 'pier'}}
        },
        # drawing_kwargs:
        #   Reference a name previously defined in the 'layers' argument and specify matplotlib parameters to draw it
        drawing_kwargs = {
            'background': {'fc': '#F2F4CB', 'ec': '#dadbc1', 'hatch': 'ooo...', 'zorder': -1},
            'perimeter': {'fc': '#F2F4CB', 'ec': '#dadbc1', 'lw': 0, 'hatch': 'ooo...',  'zorder': 0},
            'green': {'fc': '#D0F1BF', 'ec': '#2F3737', 'lw': 1, 'zorder': 1},
            'forest': {'fc': '#64B96A', 'ec': '#2F3737', 'lw': 1, 'zorder': 1},
            'water': {'fc': '#a1e3ff', 'ec': '#2F3737', 'hatch': 'ooo...', 'hatch_c': '#85c9e6', 'lw': 1, 'zorder': 2},
            'parking': {'fc': '#F2F4CB', 'ec': '#2F3737', 'lw': 1, 'zorder': 3},
            'streets': {'fc': '#2F3737', 'ec': '#475657', 'alpha': 1, 'lw': 0, 'zorder': 3},
            'building': {'palette': ['#FFC857', '#E9724C', '#C5283D'], 'ec': '#2F3737', 'lw': .5, 'zorder': 4},
        }
)
Pick a Palette
Inorder to make a great visiualization, a great color palette is a must have. I used Coolor to help me choose right color for the visiualization.
Examples


 all of code can be found in Here